Modelling Early Food Production in
the Mid-Holocene of the Eastern Sahara.
A Sustainable Rural Livelihood Approach
Thesis submitted by: Andie Byrnes
For the degree of: Doctor of Philosophy (Ph.D.)
First supervisor: Professor Dorian Fuller
Second supervisor: Doctor Andrew Reid
The Institute of Archaeology, University College London (UCL)
Declaration:
I, Andie Byrnes, confirm that the work presented in this thesis is my own. Where information has been derived from other sources, I confirm that this has been indicated in the thesis.
28th February 2019
Acknowledgements
I would like to thank my supervisors Professor Dorian Fuller and Dr Andrew Reid for their support during the completion of the thesis. I owe particular thanks to Andrew Reid for continuing to advise me during the period of his sabbatical. I would also like to thank Professor Fekri Hassan, Dr Andrew Garrard and Professor Andrew Bevan for their advice. Many warm thanks are due to my mother and father Barbara and William Byrnes for their ongoing support and encouragement, and to Cheryll Agg for her willingness to undertake my proof reading.
Abstract
The thesis employs an approach adapted from the Sustainable Rural Livelihoods (SRL) model, which was pioneered in development economics. The model provides both descriptive and explanatory components. The purpose of the research is to determine whether the SRL approach can improve the handling of archaeological data and its interpretation. It has been tested in four case studies focusing on early food production in marginal areas of the mid-Holocene eastern Sahara. It assesses how livelihoods were practiced in terms of risk and sustainability. A strength of the SRL approach is that it incorporates the belief that all aspects of a livelihood should be allocated equal value, including economic, ecological, human wellbeing and social assets. In particular it provides the opportunity to evaluate a qualitative model to improve an understanding of the variables that might have influenced livelihood strategies in prehistory. Ethnographic data has been employed to inform an understanding of the risks and opportunities confronting populations living in arid and semi-arid environments. In the penultimate chapter the thesis compares the findings from the four case studies to test the value of the SRL model for drawing inferences about risk, opportunity and sustainability in arid and semi-arid environments. Whilst the research is not problem-orientated it does identify gaps in current research with a view to recommending new research priorities.
Impact Statement
The Sustainable Rural Livelihood approach is derived from problem-orientated development economics but this thesis assesses it in terms of its value to academic archaeology. Within archaeology the research has two possible applications: 1) in the design of field archaeology projects that seek to prioritise data collection and 2) in the field of data analysis and interpretation after excavations have taken place. To test the value of the latter, I plan to publish the SRL approach online, together with all four case studies, to engage in discussion with researchers who have expertise in these areas, to measure the value of the approach and to refine it. The same methodology could be applied usefully to ethnographic research, following an analysis of its potential role in ethnographic theoretical approaches. Looking beyond academic applications, it would be interesting to apply the model to studies of small communities impacted by heritage tourism, where it could be used not merely to assess impacts but to devise solutions to some of the more pressing problems being experienced. Although I have not yet investigated the possibilities of the SRL approach as a collaborative tool, I would hope that it will be possible to work with others to investigate other potential uses for the SRL model.
Table of Contents
1 – Introduction
1.1 Introduction to the research questions
1.2 Hypotheses
1.3 Methodology
1.4 The Sustainable Rural Livelihood Mode
1.5 Ethnographic Analogy
1.6 The Case Studies
1.7 Literature Reviews
1.8 Structure of the thesis
1.9 Terminology
1.10 Conclusions
2 – Modelling Early Food Production: A Sustainable Rural Livelihood Approach
2.1 Modelling dryland livelihoods
2.2 The Sustainable Rural Livelihood Model
2.3 Supporting Models
2.4 Initial Testing of the SRL Framework
2.5 Conclusions
3 – Situating the SRL model within archaeological theoretical approaches
3.1 Introduction
3.2 Archaeological approaches to modelling past communities
3.3 Issues of scale
3.4 Qualitative Research
3.5 Conclusion
4 – Climate and environment history in the eastern Sahara
4.1 Introduction
4.2 Introduction to the Post-Glacial Eastern Sahara
4.3 The Middle Holocene c.7000 – 3500 BC
4.4 Hydrology in the Eastern Sahara
4.5 Climate change and human behaviour
4.6 Conclusions
5 – The Vulnerability Context: Risk and Uncertainty in Dryland Environments
5.1 Introduction
5.2 Subsistence and production in dryland environments
5.3 The Nature of Risk and Uncertainty 5.4 Coping with Risk
5.5 Coping with Uncertainty
5.6 Conclusions
6 – Introduction to the Case Studies
6.1 Introduction
6.2 Case Study Backgrounds
6.3 Conclusions
7 – Applying the SRL Approach to the Case Studies
7.1 Introduction
7.2 Template for the Archaeological Analysis
7.3 Building the Case Studies
7.4 Livelihood Variables
7.5 Livelihood Outcomes
7.6 Key questions
7.7 Conclusions
8 – Case Study 1 (Abridged): Nabta Playa in the Ru’at el-Baqar
8.1 Introduction
8.2 The data available for each phase
8.3 The Livelihood Status
8.4 The Livelihood Variables
8.5 The Livelihood Outcomes
8.6 Answering the key questions
8.7 Conclusions – the value of the SRL model in this area
9 – Comparative Findings and Future Research
9.1 Introduction
9.2 Comparative Findings
9.3 Conclusion
10 – Final Conclusions
10.1 Introduction
10.2 Case Study Findings
10.3 The limitations and benefits of the SRL Model
10.4 Conclusions
Appendix A – Glossary of Terms
Appendix B – Templates and Evaluation Criteria
Appendix C – Milk and Lactose Intolerance
Appendix D – Opportunity and resistance to change
Appendix E – Human Nutritional Requirements
Appendix F – Comparative values of livestock
Appendix G – Potential Archaeological Indicators
Appendix H – Test Case Study: The Hadendowa of the Beja
Illustrations
Figure 1.1 – The regions where the four case studies are based (Source: Google Earth)
Figure 1.2 – The Sustainable Rural Livelihood Model
Figure 1.3 – Schematic showing the main stages in the completion of the thesis
Figure 2.1 – Components in sheep production (Spedding 1975, figure 2.16, p.32)
Figure 2.2 – Conceptual box-and-arrow model of integrated resources
Figure 2.3 – Venn diagram of components necessary for a sustainable livelihood (Rosen and Kishawy 2012, p.156 )
Figure 2.4 – The POET model
Figure 2.5 – The SEIC model (Tabara and Pahl-Wostl 2007, figure 2). S = structure and ruling institutions; E = energy and resources; I = information and knowledge; C = social-environmental change and Zi is the size of the sociological ecological system i.
Figure 2.6 – Components and interactions in INRM (Source: Attah-Krah 2006, figure 1, p.10)
Figure 2.7 – The RLS Mandala
Figure 2.8 – MEA ecosystems conceptual framework (Source: MEA Board 2003, Box 2, p.9)
Figure 2.9 – The Sustainable Livelihood model in the DFID Guidelines (DFID 1999, figure 1, p.1)
Figure 2.10 – The dynamic nature of assets in a modern development economics scenario (Sayer and Campbell 2001, figure 10, p.218)
Figure 2.11 – The Personal asset added to the Asset Matrix in 2007 (Source: Hamilton-Peach and Townsley 2007)
Figure 2.12 – The SRL Model, modified for use in archaeology
Figure 2.13 – The livelihood asset matrix
Figure 2.14 – Variables in the asset matrix, based on the DFID Guidelines (DFID 1999)
Figure 2.15 – DFID pentagon for a specific urban context. In this example the livelihood seems unsustainable as it shows poor human, financial (subsistence) and natural assets together with declining access to physical and social assets (DFID 1999, section 2.1)
Figure 2.16 – Radar diagram from Chatper 9 and Appendix H showing the radar diagram from the Hadendowa test case study, demonstrating that whilst relatively sustainable in some areas, the cutting of trees for fuel and charcoal for urban centres has undermined natural resources, and that social structures are being impacted by the loss of young men and families to the same urban areas
Figure 2.17 – Livelihood varaibles within the SRL model
Figure 2.18 – The livelihood Outcomes section of the diagram
Figure 2.19 – Components in a decision to grow a particular crop
Figure 2.20 – Relative values of cattle, sheep, pig and goat in dryland subsistence economies
Figure 3.1 – Gumerman’s mechanistic model of cultural-environmental relationships (Source: Gumerman 1988b, p.8, figure 1.1)
Figure 3.2 – Gumerman’s dynamic model of cultural-environmental relationships showing a more integrated approach (Source: Gumerman 1988b, p.14 figure 1.2)
Figure 3.3 – J.G.D. Clark’s system diagram 1957
Figure 3.4 – David Clarke’s systemic model (Source: Clarke 1978, p.134)
Figure 4.1 – The Eastern Sahara today (Source: NASA)
Figure 4.2 – Calibrated Radiocarbon dates showing the occupational history of key areas on a north to south trajectory, with human abandonment of the desert areas coinciding with the beginning of aridification in the eastern Sahara. (Source: Kuper and Riemer 2013, p.35, figure 1.5)
Figure 4.3 – Water from the Nubian Aquifer at Dakhleh Oasis (Source: Dakhleh Oasis Project https://bit.ly/2KgyUQT)
Figure 4.4 – Savannah rainfall event (Source: Soraya Romero, DesertUSA https://bit.ly/2rCMaY8)
Figure 5.1 – Pastoralism in the Libya Sahara. Source: Stephen Dueppen, https://blogs.uoregon.edu/dueppen/african-pastoralism/
Figure 5.2 – Wet and dry season pastures used by the Woɗaaɓe of southeastern Niger. (Source: Schareika 2003, p.20, 38) 1
Figure 5.3 – View of a degrading landscape in Niger (Source: Patrice Savadogo http://drylandsystems.cgiar.org/regions/west-african-sahel-and-dry-savannas)
Figure 5.4 – Schematic representation of mobility patterns. Black dots indicate the main group; grey dots indicate segments of the group. (Source: Wendrich and Barnard 2008, p.5, figure 1.2)
Figure 5.5 – Sahelian drought 2012 in Chad showing dry lake bed. Source: Al Jazeera https://www.aljazeera.com/indepth/inpictures/2012/06/2012624213039862469.html
Figure 6.1 – The four areas discussed in the case studies (Source: Google Earth)
Figure 6.2 – Map of sites at Nabta Playa, annotated with a colour-coded key, added to show sites mentioned in the text (Source: Wendorf and Schild 2001a, fig 1.2, p.5)
Figure 6.3 – Nabta Playa components during the Rua’t el Baqar. Clockwise from top left, the shaped stone from Complex Structure A (Source: Wendorf and Schild 2002, plate 36); black-topped ware (source: Nelson and Khalifa 2010, p.148, figure 4), Articulated cattle skeleton from tumulus E-94-1N (source: Schild and Wendorf 2015, p.367, figure 24) and the stone cirlce at E-92-9 (source: Schild and Wendorf 2015, p.367, figure 24)
Figure 6.4 – Ru’at el Baqar lithics from E-75-8 (Source: Nelson 2001, p.396)
Figure 6.5 – Map of the Badarian sites (Source: Tassie 2014, p.249)
Figure 6.6 – A range of artefacts from Badarian graves (Source: Tassie 2014, p.257, figure 77) 144
Figure 6.7 – Examples of ceramics from th Badari region (Source: Petrie Museum of Egyptian Archaeology)
Figure 6.8 – Map of the Gilf Kebir showing the main wadis where the sites mentioned in the text are located (Source: Schön 1996, p.20)
Figure 6.9 – Gilf C artefacts Top: Ceramics (source: left Classen and Pastoors 2005, p.275, figure 6; right Kuper, Leisen et al 2009a, p.18, figure 18); Second row: Gilf-type grinders (source: Kuper et al 2010, p.22, figure 24); Bottom row: Lithics (Source: Gehlen et al 2002, p.106, figure 13) 150
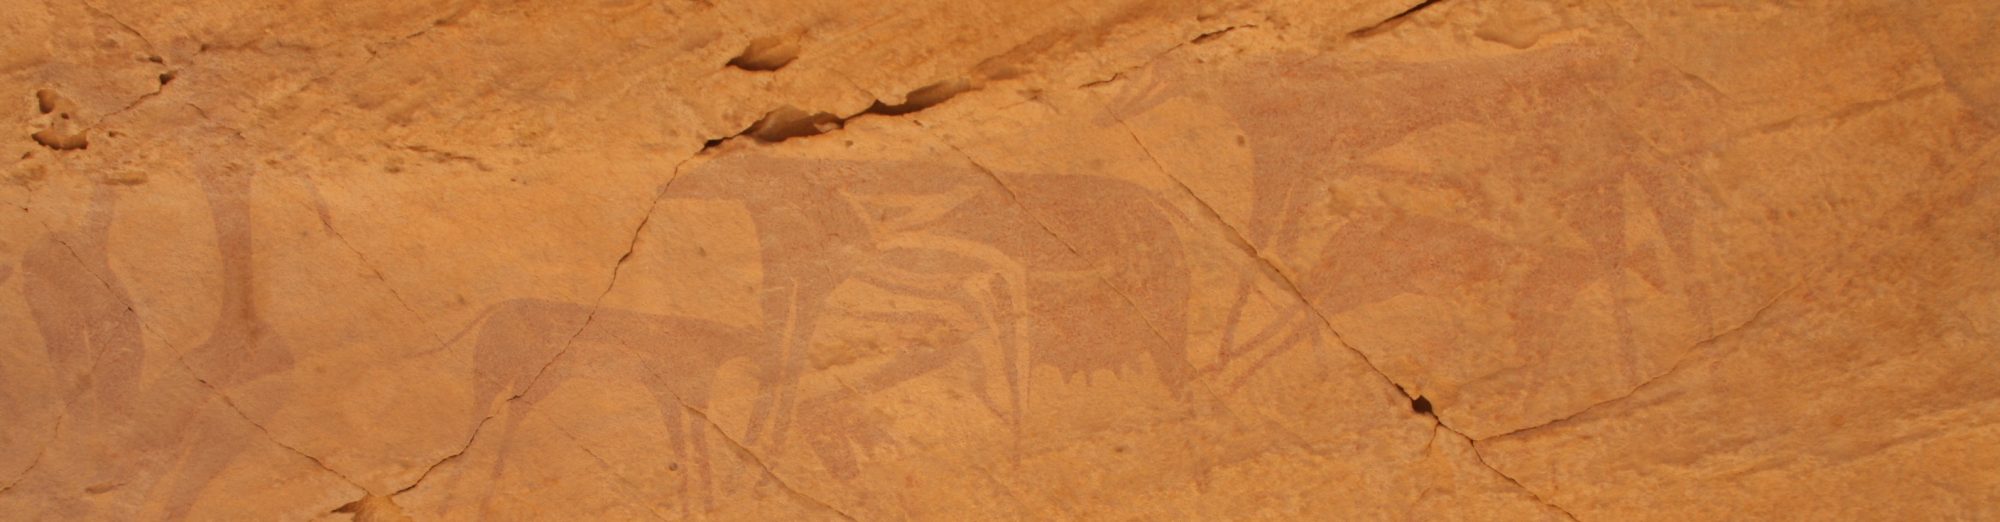
Figure 6.10 – Cattle paintings in the Gilf Kebir. Clockwise from top left: Wadi Sura I (photgraph Andie Byrnes); WG25 (Source: Zboray 2013, p.19) Wadi Sura I (photograph Andie Byrnes); AM51, Wadi Abd El Melik, (Source: Zboray 2010, p. 242, figure 2)
Figure 6.11 – Map of Dakhleh Oasis showing the Limestone Plateau behind it. (Source: Riemer 2011. P.18, figure 1)
Figure 6.12 – Lithics from Dakhleh Oasis. (Sources: McDonald 3013, p.185, figure 7; McDonald 1991, p.49)
Figure 6.13 – Ceramics of the Bashendi B. (Source: Hope 2002, p.44, figure 2)
Figure 7.1 – Potential mechanisms for acquiring decorative stones and shells from the Eastern Desert
Figure 7.2 – Critera for assessing tool manufacturing strategy (based on Shea 2013, p.39-45)
Figure 7.3. A seasonal schedule over 2 years, assuming the possibility of cereal cultivation and herding. Based on Butzer 1976; Hassan 1984, Midant-Reynes 1992, p.140 and Yokell 2014
Figure 7.4 – Choices facing occupants of the Gilf Kebir at the end of the mid-Holocene
Figure 8.1 – The location of Nabta Playa, also showing other places mentioned in the text (Source: Google Earth)
Figure 8.2 – Map of Nabta Playa. Modified from Wendorf and Schild 2001a, fig 1.2, p.5
Figure 8.3 – Site E-92-7. Area A Hearths 9 and 10. (Source: Krölik and Fiedorczuk 2001 p.343, fig 9.10)
Figure 8.4 – Site E-94-3, showing a small stone-filled hearth before excavation (Source: Mohamed 2001, p.456, p.figure 13.14) 190
Figure 8.5 – Raw materials found in debitage at three sites at Nabta Playa in the Late Neolithic (totals compiled from Wendorf, Schild and Associates 2001, tables 9.9, p.346; 10.5, p.364; 11.5, p.402). 191
Figure 8.6 – A selection of Ru’at el Baqar lithics from E-75-8 (Nelson 2001, p.396). a, c denticulates; b, notch; d, lunate; e, varia; f, endscraper; g, groundstone; h, retouched Aterian point; i, biface; j, crescent/lunate; k, backed piece; l, bifacial projectile point; m, retouched side-blow flake
Figure 8.7 – Site E-94-3 Retouched Tools. a, endscraper on reused Levallois flake. b and f, perforators; c and d, points; e and h, denticulates; g, i and j pieces with continuous retouch (Source: Mohamed 2001, p. 459, figure 13.15)
Figure 8.8 – Critera for assessing tool manufactruing strategy (based on Shea 2013, p.39-45)
Figure 8.9 – Lithics and worked bone from E-75-8 (Source: Nelson 2001, p.399, figure 11.10. a, perforator; b, endscraper; c, lunate; d, truncation; e, retouched piece; f, denticulate; g, groundsetone; h,i, worked bone
Figure 8.10 – Site E-94-3. Groundstone artefacts. a, milling stone; b, handstone; c, notched stone (Source: Mohamed 2001, p.461, figure 13.16)
Figure 8.11 – Black-topped pottery (Source: Nelson and Khalifa 2001, p.148, figure 4)
Figure 8.12 – Site E-94-2 Red Ware bowl rims (Source: Nelson 2002, p.36, figure 3.19)
Figure 8.13 – Fulani woman moving camp in the dry season prior to a 28km walk (Source: Stenning 1959, p. ii, plate 1)
Figure 8.14 – Plan views of tumuli E91-1N, the articulated cow burial and E-97-5, the human burial (Applegate et al 2001, p.470, figure 15.1 and page 477, p.15.6)
Figure 8.15 – Site E-92-9. Stone Circle (Schild and Wendorf 2001a, p.37, figure 2.27)
Figure 8.16 – The E-92-9 stone circle (3.6m diametre) F(Schild and Wendorf 2015, p.367, figure 24)
Figure 8.17 – Site E-96-1 Complex Structure A showing : 1, the tablerock; 2, cemented sand with small rock slabs; 3, playa silt; 4, silt backfill inside pit; 5, sculptured stone; 6, laminated sand and silt; 7, surface stones (Wendorf and Królik 2001 p.509, figure 17.8)
Figure 8.18 – Alignment A, Megalith A-2. Tilted and collapsed, originally composed of four upright stelae (Schild and Wendorf 2015, figure 9)
Figure 8.19 – a) Panicum turgidum (Microphotograph of seed impression on pottery, Magid 2001, p.608; photograph Mahmoud 2010, p.104) and b) Setaria sp. (Microphotograph of seed impression Magid 2001, p.608; photograph Burke 2012, p.145)
Figure 8.20 – The Livelihood Variables section of the SRL Model, framed in red
Figure 8.21 – The Livelihood Outcomes part of the matrix, framed in red
Figure 9.1 – QFD analysis of the relative merits of cattle, sheep, goat and pig
Figure 9.2 – The relative benefits of emmer wheat, barley and sorghum
Figure 9.3 – Choices facing occupants of the Gilf Kebir at the end of the mid-Holocene
Figure 9.4 – Choices facing occupants of Dakhleh Oasis at the end of the mid-Holocene
Figure 9.5 – Choices facing occupants of Dakhleh Oasis at the end of the mid-Holocene
Figure 9.6 – Choices facing occupants of the Badarian at the end of the mid-Holocene
Figure 9.7 – Assigning values to the Asset Matrix
Figure 9.8 – Radar diagrams showing strengths and weaknesses of each asset category
Figure 9.9 – The combined radar diagrams of the archaeological case studies
Figure 9.10 – Radar diagram for the modern Hadendowa
Tables
Table 1.1 – Chronology of the main archaeological units mentioned in the text
Table 2.1 – Characterization of assets and measures of sustainability
Table 2.2 – Vulnerability variables (Nelson et al 2016)
Table 2.3 – Population-resource and social-resource conditins
Table 2.4 – The Evidence for risk management strategies in the Gilf Kebir
Table 5.1 – Three-phase economic response to drought, summarized in Manger et al 1996 p.138-9
Table 5.2 – Three stages of coping seen in terms of environmental and livelihood impact (Source: Schrimpf and Feil 2012, p.10)
Table 7.1 – Template for Presenting SRL Data
Table 7.2 – Data available for each of the case studies
Table 7.3 – The main sites discussed in the case studies are listed in a table in section 2
Table 7.4 – Example, showing the radiocarbon dates available for sites in the case studies
Table 7.5. Indicators for the Asset Matrix
Table 7.6 – Natural Asset zones
Table 7.7 – Risk management strategies employed at Nabta Playa during the Ru’at el Baqar
Table 8.1 – Data types available for the Ru’at el-Baqar Late Neolithic
Table 8.2 – Ru’at el-Baqar Neolithic sites mentioned in the text (Wendorf, Schild and Associates 2001)
Table 8.3 – Late Neolithic Radiocarbon Dates (Schild and Wendorf 2001, p.53-4, Table 3.1)
Table 8.4 – Natural Asset Zones
Table 8.5 – Plant taxa present in the Ru’at el-Baqar
Table 8.6 – Animal species present in the Ru’at el-Baqar (MNI)
Table 8.7 – Evidence for domesticated animals at Nabta Playa in the Ru’at el Baqar
Table 8.8 – Evidence for wild animal species exploited in the Ru’at el-Baqar
Table 8.9 – Evidence for plant species exploited in the Ru’at el-Baqar
Table 8.10 – Plant species that may have been exploited in the Ru’t el-Baqar
Table 8.11 – Evidence for aquatic species in the Ru’at el-Baqar
Table 8.12 – Herders’ daily routine (Schareika 2003, p.16, Table 1)
Table 8.13 – Ru’at el-Baqar period plant species
Table 8.14 – Potential nutritional contributions of animal species in the Ru’at el Baqar
Table 8.15 – Vulnerability variables
Table 8.16 – Vulnerability estimates for the Ru’at el-Baqar
Table 8.17 – Risk management strategies employed in the Ru’at el-Baqar
Table 9.1 – Risk management strategies compared
Table 9.2 – Vulnerability variables (after Nelson et al 2016)
Table 9.3 – Vulnerability variables for the case studies (extrapolated)
Table 9.4 – Nutritional Values of Plant Species
Table 9.5 – Nutritional Values of Animal Species
Table 9.6 – Suggested group sectors in which decisions may be visible
Table 9.7 – Suggested group sectors in which identity may be expressed
